How Is a DDoS Resilience Test Performed? Capacity, Thresholds and Bottleneck Analysis
DDoS resilience is not a single number. This chapter covers capacity planning, the Gbps/PPS/CPS/RPS metrics, threshold setting, bottleneck analysis and the detect-mitigate-recover timings.
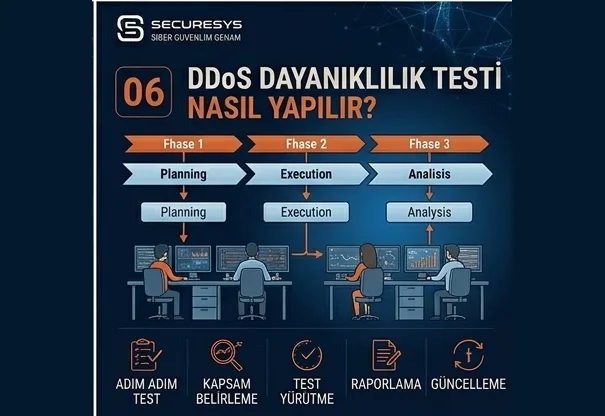
Saying that an organisation is strong against DDoS attacks is easy.
Measuring it is harder.
Because DDoS resilience is not simply a matter of internet link capacity.
A system's real limit can appear in any one of many components, such as;
the firewall,
routers,
the load balancer,
the WAF,
the CDN,
the anti-DDoS service,
the application server,
the API gateway,
the database,
the DNS infrastructure.
Any of them can be the first to give.
In corporate DDoS security the right question is therefore not:
“How many Gbps of attack can we withstand?”
but:
“Under which traffic profile, which component becomes the bottleneck at which threshold, and when does service quality degrade?”
That is the question to answer.
The answer emerges from DDoS resilience testing, capacity planning, threshold analysis and bottleneck analysis.
A professional DDoS resilience test is not merely about generating traffic. It is about measuring the system's behaviour under attack, identifying critical thresholds, validating security controls and understanding to what level the service remains sustainable.
What Is DDoS Resilience Testing?
DDoS resilience testing is an authorised security test measuring how available an organisation's internet services remain under different DDoS traffic profiles and how effectively the security controls work.
Various scenarios can be assessed within this test, such as;
- volumetric traffic,
- layer 3/4 attack profiles,
- layer 7 request intensity,
- DNS traffic,
- API load,
- connection exhaustion,
- bot traffic.
Each stresses a different part of the chain.
The aim is not to crash the system uncontrollably.
The aim is to draw the capacity curve within safe boundaries.
What Is DDoS Capacity Planning?
DDoS capacity planning is the advance analysis of the technical capacity an organisation has against attack traffic.
Questions such as these are asked:
How many Gbps is the internet connection?
What is the maximum PPS the firewall can process?
How many CPS can the load balancer handle?
How many requests per second can the WAF analyse?
At what RPS does the API gateway stay within SLA?
How many QPS can the DNS service handle?
All of these values must be assessed together.
Because the weakest link in the chain determines the real DDoS capacity.
Does Gbps Alone Show DDoS Capacity?
No.
This is one of the most important misunderstandings.
Say the organisation's internet link is:
20 Gbps
in capacity.
At first glance that looks quite strong.
But if the firewall can process only:
3 million PPS
then a dense attack made of small packets can exceed that limit far sooner.
Equally the network can stay entirely up while the application falls outside SLA above:
5,000 RPS
in request volume.
DDoS capacity must therefore be assessed across at least these four metrics:
Gbps
PPS
CPS
RPS
Why Is PPS Critical?
Packets per second (PPS) shows the number of packets processed per second.
Attacks made up of small packets can strain the packet processing capacity of network devices.
For example:
5 Gbps of traffic may look high.
But if that traffic consists of large packets, the PPS may be relatively low.
Another attack may be 2 Gbps.
Yet because of very small packets, the PPS may be far higher.
The second attack can be more destructive for the firewall.
The throughput figures on vendor datasheets are therefore not sufficient on their own.
Why Does CPS Matter?
Connections per second (CPS) shows the number of new connections created per second.
It is a critical metric for stateful firewalls and load balancers.
A device may support millions of concurrent sessions.
But its capacity to create new connections per second may be lower.
Attacks such as SYN floods or TCP connection floods therefore target the CPS limit.
What Is RPS?
Requests per second (RPS) expresses the number of requests arriving at a web application or API per second.
It is one of the most critical metrics in layer 7 DDoS testing.
But RPS alone is not enough either.
Because:
1,000 RPS of static content
and
1,000 RPS of heavy database queries
do not create the same impact.
Request cost must therefore be assessed alongside RPS.
What Is QPS?
One of the metrics frequently used in DNS environments is:
Queries Per Second (QPS)
as a value.
It shows how many queries per second the DNS service can answer.
During DDoS resilience testing;
normal QPS,
peak QPS,
attack QPS,
response latency,
timeout rate
must be analysed together.
What Is a Traffic Baseline?
Before a DDoS test begins, the system's normal behaviour must be known.
That normal behaviour is called the traffic baseline.
During the organisation's normal working hours, for instance;
average traffic: 800 Mbps
peak traffic: 2 Gbps
average PPS: 200,000
peak PPS: 600,000
normal RPS: 1,500
peak RPS: 4,000
may apply.
Without knowing these values it is hard to set the right thresholds.
Why Must Peak Traffic Be Assessed Separately?
Normal average traffic is usually not enough.
In an e-commerce firm, traffic can rise to several times normal during;
Black Friday,
campaigns,
product launches.
That is genuine user demand.
If DDoS protection treats that traffic as an attack because of a wrong threshold, the system can block its own customers.
When building a baseline, therefore;
normal,
peak,
seasonal
traffic must each be examined separately.
What Is a Threshold?
A threshold expresses the level at which a particular metric triggers a security or performance action.
Values such as;
SYN rate > 100,000/s
HTTP requests > 20,000 RPS
CPU > 85%
latency > 1,500 ms
can be used.
But static thresholds may not suit every environment.
The best threshold must be set according to the organisation's own traffic behaviour.
The Difference Between Static and Dynamic Thresholds
Static Threshold
A predetermined fixed value.
For example:
an alert above 10,000 RPS.
Dynamic Threshold
A threshold that changes according to normal traffic behaviour.
For example:
a 300% deviation from the last 30 days' average.
Dynamic thresholds can be far more meaningful in systems with variable traffic.
What Is an Adaptive Threshold?
An adaptive threshold is one the system changes dynamically as it continuously learns traffic behaviour.
The system may expect high traffic at lunchtime on weekdays, for instance.
If it sees the same traffic at night it can treat it as an anomaly.
This approach can reduce the false positive rate in DDoS detection.
What Is Bottleneck Analysis?
Bottleneck analysis is the process of identifying the component that reaches its capacity limit first under attack.
It is one of the most valuable outputs of DDoS resilience testing.
Because the problem is not always where it is expected.
The organisation may believe the firewall is the constraint.
But in a real test;
the load balancer,
DNS,
the database,
the authentication service
may hit the bottleneck first.
Where Can Bottlenecks Form in the DDoS Chain?
The general traffic path can be thought of as follows:
Internet
↓
ISP
↓
Anti-DDoS / Scrubbing
↓
Router
↓
Firewall
↓
WAF
↓
Load Balancer
↓
Application
↓
Database
Any component in this chain can be the bottleneck.
Capacity analysis must therefore be carried out end to end.
How Is an Internet Link Bottleneck Identified?
When the internet link reaches saturation with attack traffic;
packet loss can rise,
latency can climb,
genuine user traffic can fall,
a service outage can occur.
In that situation the internal firewall may still be at a low CPU level.
Because the traffic is not reaching the organisation's link in the first place.
Upstream visibility is therefore important in high-volume attacks.
How Is a Firewall Bottleneck Identified?
On the firewall, the values for;
CPU,
memory,
the session table,
PPS,
CPS,
the NAT table
must be monitored.
The internet link may be 40% full while firewall CPU reaches 100%.
In that case the real limit is not bandwidth but firewall capacity.
Presenting only a traffic graph in a DDoS test report is therefore not enough.
Load Balancer Bottlenecks
A load balancer performs;
connection handling,
SSL termination,
health checks,
traffic distribution.
During a DDoS attack;
CPS,
concurrent connections,
TLS handshake rate
can rise.
Even if the backend systems have sufficient capacity, the load balancer can hit its limit.
Load balancer telemetry must therefore be monitored separately during testing.
TLS Handshake DDoS Risk
Establishing an HTTPS connection requires a certain amount of CPU work for the TLS handshake.
Creating large numbers of new TLS connections can create additional processing load on;
the load balancer,
the reverse proxy,
the WAF.
In DDoS capacity testing, therefore, TLS connection rate can matter as much as HTTP requests.
Can the WAF Become a Bottleneck?
Yes.
While analysing traffic, the WAF performs operations such as;
signature matching,
behavioural rules,
bot analysis,
rate limiting.
Under heavy layer 7 attacks the WAF's own processing capacity can become the limit.
Faulty rules or complex regular expressions can also affect performance.
The WAF must therefore be assessed for capacity as well as for security control.
Application Server Bottlenecks
On the application server;
CPU,
memory,
the thread pool,
the worker pool,
queue length
are critical metrics.
During a DDoS attack, degradation in these values can appear before response time rises.
Application monitoring is therefore an inseparable part of DDoS testing.
Why Are Database Bottlenecks So Common?
In layer 7 attacks the database is frequently the real bottleneck.
Because every user request can create an SQL query in the background.
Operations such as;
search,
reporting,
login,
filtering
can make heavy use of the database.
In DDoS testing, therefore, database metrics such as;
query time,
CPU,
IO,
connection pool,
locks
must be monitored.
Connection Pool Bottlenecks
There is a limited number of connections between the application and the database.
When those connections are fully used, new user requests queue.
The application can become unreachable even while the system shows low CPU usage.
Monitoring CPU alone is therefore inadequate.
Can the Cache Become a Bottleneck?
Caching generally improves performance.
But situations such as;
cache misses,
cache stampede,
cache eviction
can increase backend load during an attack.
The attacker can create a cache bypass by continuously requesting different URLs.
Origin traffic can then rise rapidly.
Why Should Cache Hit Ratio Be Monitored?
Cache hit ratio shows what proportion of requests are answered from the cache.
If a system that normally sees a 90% cache hit rate drops to 20% during an attack, the load on the origin rises sharply.
This behaviour is an important indicator in layer 7 DDoS.
Does Autoscaling Solve Bottlenecks?
Autoscaling can be the solution for certain resources.
The number of application instances can grow as traffic rises, for instance.
But not every component scales automatically.
The database,
legacy applications,
third-party APIs
can each form a limit.
Scaling one layer of the system may therefore not solve the whole chain.
The Difference Between Horizontal and Vertical Scaling
Vertical Scaling
Adding more CPU or RAM to a single server.
Horizontal Scaling
Adding new servers or instances.
Horizontal scaling is generally more flexible for DDoS resilience.
But the load balancer and backend architecture must support it.
Why Does SLA Matter in DDoS Testing?
Service quality can degrade before the system goes down entirely.
An SLA may be:
Response time < 1 second
Availability > 99.9%
During a DDoS test the system may still be responding.
But if response time has risen to 8 seconds, the SLA has been breached.
The success criterion should therefore not be:
“Does the site load?”
alone.
The Concepts of SLO and SLI
A service level indicator (SLI) is the performance metric measured.
Response time, for example.
A service level objective (SLO) is the targeted performance level.
For example:
99% of user requests must be answered in under 1 second.
DDoS resilience tests become far more meaningful for the business when assessed alongside SLIs and SLOs.
How Are Stop Conditions Determined in a DDoS Test?
Stop conditions are the safety boundary of a controlled test.
Traffic escalation can be halted when, for example;
packet loss > 5%
response time > 3 seconds
CPU > 90%
error rate > 10%
is reached.
These values must be set according to each organisation's business criticality and risk tolerance.
What Are Soft and Hard Limits?
Two different limits can be used during a test.
Soft Limit
The system has approached the warning level.
Traffic escalation is stopped.
Hard Limit
A critical system risk has formed.
The test is terminated entirely.
This approach increases safety in production environments.
What Is Graceful Degradation?
An ideal system can limit certain features under attack rather than failing entirely.
This approach is called graceful degradation.
For example;
the reporting service is switched off,
the search function is limited,
static content continues to be served,
critical payment transactions are protected.
This method can preserve the availability of critical business functions.
What Is Load Shedding?
Load shedding is the rejection of certain low-priority requests while the system is under excessive load, in order to protect critical services.
For example;
anonymous search requests can be limited,
high-cost reporting operations can be temporarily disabled,
critical authenticated transactions can be protected.
This approach is extremely valuable for layer 7 DDoS resilience.
Priority-Based Traffic Management
Not all traffic carries the same business value.
For a bank, for instance;
a money transfer
and
a campaign banner
do not carry the same importance.
The application architecture can therefore give higher priority to critical transactions.
During a DDoS attack this approach helps protect business continuity.
How Is Failover Measured in a DDoS Test?
An organisation may have a second data centre or cloud region.
But the theoretical existence of failover is not enough.
During a DDoS test, mechanisms such as;
traffic switching,
DNS failover,
the secondary region,
backup connectivity
can be verified.
The core question here is:
When the first environment becomes unusable, does the second really take over?
Active-Active Architecture
Active-active is an architecture in which several systems or locations run actively at the same time.
For DDoS, traffic can be spread across different regions.
This structure can increase the availability level.
But global load balancing and data consistency must be designed correctly.
Active-Passive Architecture
In the active-passive model the main system runs actively while the backup sits on standby.
Failover is performed when a problem occurs on the main system.
The critical metric here is:
Failover Time
and its measurement.
Measuring that period during a DDoS attack is important.
Why Does RTO Matter for DDoS?
Recovery time objective (RTO) expresses how quickly a service must return after an outage.
Even if a DDoS attack cannot be prevented entirely, business impact falls if the service can be restored quickly.
DDoS resilience therefore covers recovery capacity as well as prevention.
Does RPO Matter for DDoS?
Recovery point objective (RPO) relates more to data loss tolerance.
DDoS attacks generally do not cause data loss.
But if other systems or operations are affected during the attack, RPO can still be assessed within business continuity plans.
What Is Time to Detect?
Time to detect (TTD) is the period between the attack starting and the security team identifying it.
For example:
00:00 the attack began.
00:45 anti-DDoS raised an alert.
01:20 the SOC confirmed the incident.
Different detection times can be measured here.
The lower the TTD, the faster the response to the attack can begin.
What Is Time to Mitigate?
Time to mitigate (TTM) is the period from the attack starting to effective mitigation engaging.
It is one of the most critical metrics of DDoS resilience.
Because even if the system can withstand the attack, user experience is degraded for a long time if mitigation starts too late.
What Is Time to Recover?
Time to recover is the period a system takes to return to normal performance after the attack ends or mitigation completes.
On some systems, performance does not return to normal immediately after the attack because of;
connection backlog,
cache problems,
database load,
autoscaling cleanup.
Recovery time must therefore be measured separately.
How Can a DDoS Resilience Score Be Built?
An organisation can build its own DDoS maturity score.
The following areas can be scored, for example:
Network Capacity
Detection
Mitigation
Application Resilience
DNS Resilience
SOC Response
Incident Response
Business Continuity
Progress over the years can thereby be measured.
But the score must not turn into a marketing metric on its own.
The real technical measurements beneath it must be preserved.
Technical KPIs for DDoS Resilience
Example KPIs might be:
Maximum Sustainable Gbps
Maximum Sustainable PPS
Maximum CPS
Maximum Layer 7 RPS
Maximum DNS QPS
Detection Time
Mitigation Time
Recovery Time
Legitimate Traffic Success Rate
False Positive Rate
These metrics make corporate DDoS capacity measurable.
What Is Legitimate Traffic Success Rate?
The real aim during DDoS mitigation is not simply to stop the attack.
Genuine users must continue to receive service.
Suppose during the attack:
99% of attack traffic was blocked.
But 30% of genuine users were blocked too.
That is not successful mitigation.
Legitimate traffic success rate is therefore a critical measurement.
How Is False Positive Rate Measured in a DDoS Test?
Genuine user traffic or simulated legitimate traffic can also be sent during the test.
Then;
how many genuine requests were blocked,
how many sessions received a challenge,
how many users experienced a timeout
is measured.
This shows whether the anti-DDoS or WAF policy is too aggressive.
Real User Monitoring During a DDoS Test
Real user monitoring (RUM) measures the experience genuine users have in the web application.
Metrics such as;
page load time,
transaction time,
JavaScript errors,
session failures
can be collected.
RUM data is extremely valuable during a DDoS test.
Because infrastructure metrics can look fine while genuine users have a poor experience.
What Is Synthetic Monitoring?
Synthetic monitoring is the continuous performance of critical transactions by automated test users rather than genuine users.
Every 30 seconds, for instance;
the home page is opened,
a login is performed,
a product is searched for,
checkout is checked.
The success of these synthetic transactions can be monitored during a DDoS test.
Genuine user experience can thereby be measured safely.
A Scenario-Based Approach to DDoS Testing
Different scenarios must be applied rather than a single traffic test.
For example:
Scenario 1 – Volumetric
Bandwidth capacity is measured.
Scenario 2 – High PPS
The packet processing limit of network devices is measured.
Scenario 3 – SYN Flood
Connection management is tested.
Scenario 4 – HTTP Flood
Web application resilience is measured.
Scenario 5 – API DDoS
The backend and API gateway are assessed.
Scenario 6 – DNS Flood
DNS resilience is measured.
This approach strengthens the scope of the DDoS test.
Why Does Multi-Vector DDoS Testing Matter?
A real attacker can use different techniques at the same time.
For example;
a UDP flood
a SYN flood
an HTTP flood
can be applied simultaneously.
Security teams then have to deal with different alerts at once.
Multi-vector tests measure SOC and incident response capacity alongside technical resilience.
Change Management in DDoS Testing
If the test is being carried out in production, the change management process matters.
Before the test;
the CAB,
network,
SOC,
application,
business
teams can be informed.
Configuration changes made during the test must be recorded.
Otherwise the reason for behaviour observed after the test may not be clearly identifiable.
Pre-Test DDoS Checklist
Before a professional test, at minimum the following must be verified:
- Is the scope clear?
- Is authorisation complete?
- Is the ISP aware?
- Have the CDN or cloud provider rules been checked?
- Has a baseline been taken?
- Are stop conditions defined?
- Is the kill switch ready?
- Is the SOC contact point identified?
- Is the application team ready?
- Is monitoring active during the test?
- Has the business owner been informed?
This preparation significantly reduces test risk.
What Should a DDoS Resilience Report Look Like?
A professional report should not give a simple “pass/fail” result.
The report can contain these sections:
Executive Summary
The overall result for management.
Architecture Overview
The architecture tested.
Baseline
Normal system behaviour.
Attack Profiles
The scenarios applied.
Capacity Results
Gbps, PPS, CPS, RPS and QPS results.
Threshold Analysis
The critical thresholds.
Bottleneck Analysis
The components reaching their capacity limit first.
Detection Timeline
Detection times for the SOC and security controls.
Mitigation Timeline
The time taken for the defence to engage.
Business Impact
User and service impact.
Remediation Roadmap
Improvement steps.
How Should a DDoS Report Be Presented to Management?
A result of the following kind is far more meaningful for senior management:
“The web platform maintained availability under a 12 Gbps volumetric attack. But at 2.8 million PPS the firewall's packet processing capacity reached a critical level. In the layer 7 scenario the login service fell outside SLA above 6,500 RPS. Anti-DDoS mitigation time was measured at 48 seconds and SOC confirmation time at 3 minutes 20 seconds.”
This output makes decisions about;
investment,
capacity,
risk
far easier.
How Much DDoS Capacity Is Enough?
There is no single answer.
The capacity required depends on;
the organisation's normal traffic,
its sector,
its threat profile,
the business impact level,
the cloud or data centre architecture.
What matters is not a competitor's capacity but the organisation's own risk profile.
DDoS capacity planning must therefore be risk-based.
Can Threat Intelligence Be Used in DDoS Capacity Planning?
Yes.
Through cyber threat intelligence;
the attack sizes seen in the sector,
the DDoS vectors in use,
botnet trends,
the service types being targeted
can be tracked.
This information can make test scenarios more realistic.
If layer 7 API attacks are rising in the organisation's sector, investing in volumetric capacity alone may not be enough.
Why Does Continuous DDoS Validation Matter?
DDoS resilience is not static.
Infrastructure changes.
New applications launch.
The firewall changes.
CDN policy is updated.
The number of APIs grows.
The cloud architecture changes.
The result of a DDoS test carried out a year ago may therefore not hold today.
Periodic DDoS security validation on critical systems is useful.
Conclusion: DDoS Resilience Is Not a Single Number
Describing an organisation's DDoS capacity with a single sentence such as:
“We have 100 Gbps of protection.”
is usually misleading.
Real resilience is multi-dimensional.
Gbps
shows bandwidth capacity,
PPS
shows packet processing capacity,
CPS
shows connection creation capacity,
RPS
shows application capacity,
QPS
shows DNS capacity.
Each measures something different.
But alongside these, operational metrics such as;
time to detect,
time to mitigate,
time to recover,
false positive rate,
legitimate traffic success rate
matter too.
And the most important question is this:
Which component runs out first during the attack?
Because a DDoS defence is always only as strong as its weakest bottleneck.
The internet link.
The firewall.
The WAF.
The load balancer.
The application.
The database.
DNS.
If any of these can no longer serve at a critical threshold, the system is unreachable from the user's point of view.
A professional DDoS resilience test therefore does not merely generate attack traffic.
It finds the system's breaking point in a controlled way.
It then recommends technical and operational improvements to strengthen that breaking point.
But knowing the capacity is not enough on its own.
How the traffic will be cleaned when the attack starts, at which layer it will be stopped and how genuine users will be protected must also be designed correctly.
At this point the most important defensive components of DDoS security come into play:
The firewall, the WAF, the CDN, anti-DDoS and the scrubbing centre.
Related Articles
Corporate DDoS Attack Simulation
What Is a DDoS Attack? Risks, Attack Types and Protection Methods for Organisations
The aim of a DDoS attack is not to break into the system but to make it unusable. This chapter covers attack types, botnet structure, protection layers and why resilience testing is essential.
What Are the Types of DDoS Attack? Volumetric, Protocol and Application Layer
Not every DDoS attack is the same. This chapter covers volumetric, protocol and application layer attacks, reflection and amplification techniques, DNS attacks and multi-vector DDoS.
What Is DDoS Attack Simulation? How Are Corporate Systems Tested?
Having DDoS protection and being ready for DDoS are not the same thing. This chapter covers controlled attack simulation, ramp-up and burst testing, stop conditions and the metrics that must be measured.
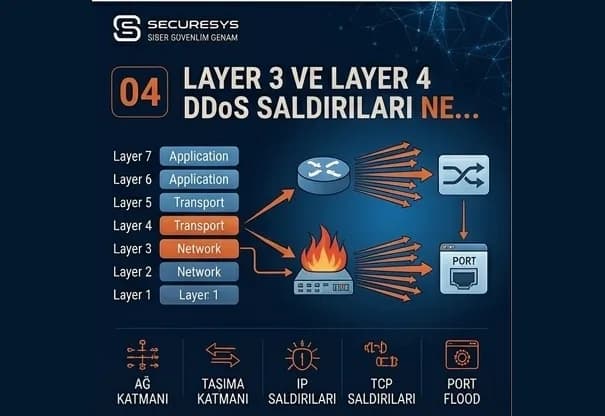
What Are Layer 3 and Layer 4 DDoS Attacks? SYN Flood, UDP Flood and Network Layer Risks
Gbps alone does not show DDoS resilience. This chapter covers SYN flood, UDP flood, ACK flood and connection exhaustion, along with PPS/CPS metrics, the firewall session table and scrubbing architecture.
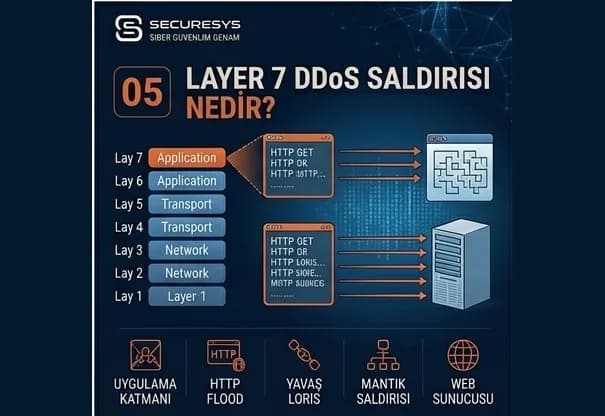
What Is a Layer 7 DDoS Attack? HTTP Flood, API DDoS and Application Layer Attacks
The biggest DDoS attack is not always the one sending the most traffic. This chapter covers HTTP floods, API and GraphQL risks, bot management, rate limiting and application bottlenecks.
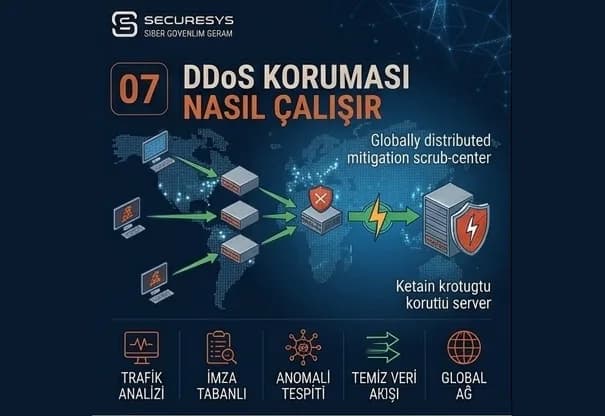
How Does DDoS Protection Work? Firewall, WAF, CDN, Anti-DDoS and Scrubbing Centres
DDoS protection is not a single device. This chapter covers the roles of the firewall, WAF, CDN, anti-DDoS and scrubbing centre, along with origin protection and the always-on/on-demand models.
Looking for professional support on this topic?
Our expert team will reach out for a free consultation as soon as possible.